Cycle Counting Basics
What is Cycle Counting?
Cycle counting (also called perpetual inventory) is the process of regularly counting a portion of your inventory to keep your DMS accurate without shutting down the entire parts department for a full physical inventory. Instead of counting everything at once, you count a few bins each day or week, gradually working through your entire warehouse.
With ScanIt Parts, cycle counting is done with the scanner. You walk up to a bin, scan every part in it, and the system compares what you physically counted against what the DMS thinks is there. Any discrepancies show up in the perpetual inventory report for your manager to review.
Step 1: Pull Inventory on the Dashboard
Before you start counting on the scanner, your manager (or you, if you have web access) needs to pull the current inventory data from the DMS into ScanIt Parts. This is done on the web dashboard and ensures the system has the latest quantities to compare against your physical count.
Step 2: Select Perpetual Inventory on the Scanner
From the main menu on your scanner, tap Perpetual to enter cycle counting mode.
Step 3: Configure Settings
Before counting, set your preferences:
Ask for Quantity
- Toggle left (off): The scanner will count by 1 each time you scan. Scan the same part multiple times to count multiple units.
- Toggle right (on): The scanner will prompt you to enter a quantity after each scan. This is faster when a bin has many of the same part.
Always Print
- Toggle left (off): No labels will print during counting.
- Toggle right (on): A label will print for each item scanned. Useful if you want to replace old or damaged labels while you count.
Step 4: Scan or Enter the Bin Location
Scan the bin barcode label on the shelf, or type the bin number manually. This tells the scanner which bin you are about to count.
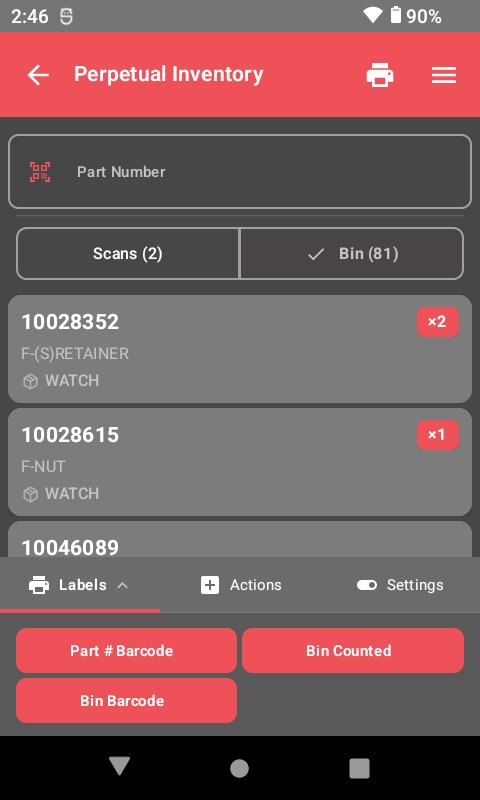
Step 5: Scan All Parts in the Bin
Scan every part in the bin. As you scan each part, the scanner records it against the expected inventory for that bin. The screen shows a running list of what you have counted so far.
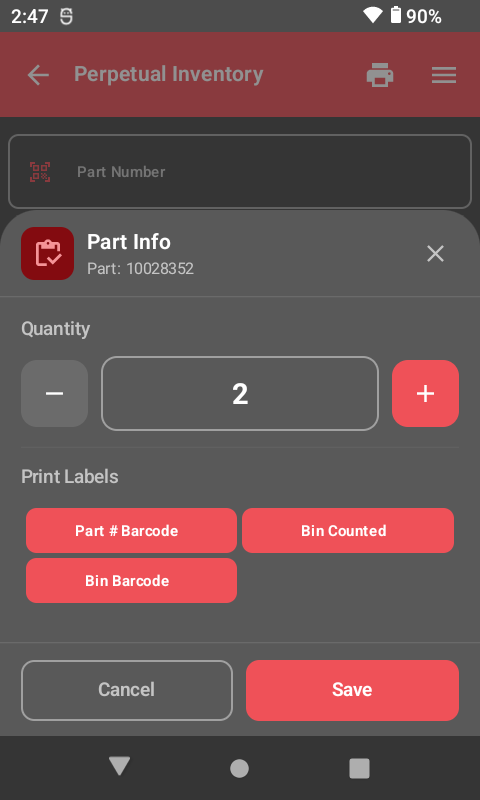
Entering Quantities: If you have 15 of the same part in a bin, you do not need to scan 15 times. Scan one, then tap the + button and select Enter Quantity to type the total count.
Switching Bins
When you finish counting one bin and want to move to the next, tap the + button and select Switch Bin. Scan or type the new bin number and continue counting.
Step 6: Print Labels (Optional)
While counting, you can print labels for any part. Two label types are available:
- Part # Barcode — Standard label with part number, barcode, bin location, and description.
- Bin Counted — A label that says "THIS BIN WAS COUNTED" with a date and time stamp. Apply it to the bin so others know it has been verified.
Step 7: Run the Perpetual Inventory Report
After counting is done, your manager runs the perpetual inventory report on the web dashboard. This report compares what you counted against what the DMS expected.
The report can be filtered by:
- Quantity exceptions only — Shows only parts where the count did not match the expected quantity.
- All parts — Shows everything that was counted, including matches.
- Part in wrong bin location only — Shows parts that were found in a different bin than expected.
The report can also be filtered by part number, bin location, or user.
The Analytics Dashboard
The perpetual inventory report includes an Analytics tab that provides deeper insight into your counting performance and inventory accuracy over time:
- Inventory Accuracy Trends — Track how your accuracy changes over time with trend lines showing improvement or decline.
- Count Completion Rates — See what percentage of bins and parts were counted during each cycle.
- Variance Analysis — Break down discrepancies by bin location, category, or user to pinpoint where problems occur most.
- Historical Comparison — Compare accuracy across previous counting cycles to measure the impact of process improvements.
Bins Not Counted Report
The Bins Not Counted tab shows which bins have not been counted during the current cycle. This helps managers ensure complete coverage and identify areas that still need attention. You can filter by bin range or area to focus on specific sections of the parts department.
The Lost Sales Report
The Lost Sales Report shows parts that were out of stock or had a zero quantity when a customer needed them. This puts a dollar value on stockouts by showing the estimated revenue impact of inventory inaccuracy. The report can be filtered by date range, part number, or category to focus on high-impact areas.
Why this matters: The Lost Sales Report helps justify the time spent on cycle counting by quantifying the cost of inaccurate inventory. When your manager can show that $5,000 in sales were lost last month due to phantom stock, it makes the case for more consistent counting.
New Feature -- Print History: During cycle counts, tap the clock icon in the top bar to review your recent print jobs. This is helpful when you need to confirm which labels you already printed for a bin.
Related Resources
Ready to See ScanIt Parts in Action?
Schedule a personalized demo and see how ScanIt Parts can transform your parts department.
Request a Demo